Monday, April 27, 2020

Week 8 - Time Travel - J.Haynes

My Wife and I decided to visit Fernandina Beach, Florida, 5,000 years into the future. Prior to our traveling, I found that Fernandina is subject to a "2.15 mm/year" (NOAA, n.d.) trend rise in its' visible sea level. With this average, I multiplied the 2.15mm a year by 5,000 and resulted in 10,750mm which is 423.23 inches or 35.27 feet. Considering Fernandina Beach has an elevation of "25 ft" (Wikipedia, 2020), this general area will more than likely be 'under water' in the time of our targeted destination. Additionally, "the combined land and ocean temperature has increased at an average rate of..." "...(0.13F) per decade since 1880...", though, "the average rate of increase since 1981...", is, "...0.32F) per decade. (Dahlman & Lindsey, 2020) Given .13F per decade is .013 per year, multiplied by 5,000 is an estimated temperature increase of 65F. Of course, this is not calculated with the increase or decrease affect of negative human-caused anthropogenic activities that increase greenhouse gases such as, deforestation, pollution, and fossil fuel burning.

We expected at least a 35-foot difference in sea-level and planned accordingly by teleporting a farther distance from the shore and during the 'winter' months with Kayaks and fire suits. Upon arrival, we noticed a definite temperature increase within the month of January from the average low of "44"F (U.S. Climate Data, 2020) to greater than 160F. This seems to correlate with the .32F decade (.032F/year) increase in temperature since the 1980's as mentioned previously. This correlated data originally showed almost double the temperature increase since the advancement of technology and mass production in combination with fossil fuel burning, or anthropogenic factors. Such data proved true in the variable increase from 2020 to 7020. With this, a heavy smog was present as far as the eyes could see which combined with the difficulty in breathing due to our unadapted lungs and such hot climate.

The sight of hundreds of motorized gas boats with occupants in fire proximity suits that seemingly took the place of commuter cars due to the vast amount of water as far as the lower Georgia coast and the 160F plus temperature, inferred that nothing was done to counteract human-made global-warming factors. Considering the temperature in this time, it can also be inferred that this sort of climate change was not due to natural global warming factors.

With almost all of Florida being under water and the temperature being almost unbearable to support human-life, it definitely seems that nothing was done to stop such negative environmental factors and all individuals were forced to adapt to their current conditions. My Wife and I left after less than an hour and were ecstatic to be in our 86F south Georgia weather!

[Below Image Caption: City Underwater]

underwater city

[Above Image Credit: (Fournier, 2014)]

References:

Dahlman, L. & Lindsey, R. (16 Jan 2020). Climate Change: Global Temperature. Retrieved 27 Apr. 2020 from: https://www.climate.gov/news-features/understanding-climate/climate-change-global-temperature.

Fournier, A.B. (11 Dec 2014). City Of The Future: Would You Live Underwater? Retrieved 28 Apr. 2020 from: https://www.builddirect.com/blog/city-of-the-future-would-you-live-underwater/.

NOAA. (n.d.). Sea Level Trends. Retrieved 27 Apr. 2020 from: https://tidesandcurrents.noaa.gov/sltrends/sltrends.html.

U.S. Climate Data. (2020). Climate Fernandina Beach - Florida. Retrieved 27 Apr. 2020 from: https://www.usclimatedata.com/climate/fernandina-beach/florida/united-states/usfl0144.

Wikipedia. (2020). Fernandina Beach, Florida. Retireved 28 Apr. 2020 from: https://en.wikipedia.org/wiki/Fernandina_Beach,_Florida.

Week 8 - Time Travel - Robbie Ficalora

A time travel report!? EXCELENT!

As Evan has been monopolizing my time machine of choice, looks like its time to bust out my trusty back up:

My Phone Booth; Parked in the back of my local Circle K
Dusting of the Circuits of Time Directory, I follow the prompt of traveling 5000 years in the future... 
WHOOOOAAAAAAA!
but due to it being 2020 (or the fact that I forgot to rewind my watch... again) I end up in 7020 instead of 7010. Wait, could the prompt have been written in 2010? Naw.
Wait... I'm pretty high up... where did I land?

Denver, CO; circa 4/27/7020
Woah... NO WAY!... YES WAY! In the future it's great here! The air is clean. The water is clean. Even the dirt is clean! Humanities reliance on fossil fuels ceased over 4500 years ago leading to a boon of self sufficient green living the likes that have never been seen before. Looking to my phone which displaces the appropriate date and time (guess data infrastructure is left unchanged) and says I'm roaming (somethings never change) I begin to pull up Google... at least what Google is in the future.... I think it's a religion now?

Anyway, it turns out that polar ice caps and ocean levels were rising noticeably in 2045. While it looked like the world was doing everything in it's power to curb the issues of global warming through green living initiatives, it still was not working to reverse the effects of the green house effect. That was until scientists looked to data from the past 100 years of environmental damage and noticed that in the spring of 2020 there was a dramatic drop in carbon emissions thanks to the pandemic of Covid-19. "Thant seems a little too convenient" I thought, and as I bounced from source to source I was shown that the origin of the events that set the world into motion were idealized over time, it can be confirmed that a launching point of the "G.A.I.A" initiative was from the influence that Covid-19 had left in the world. Over the next 450 years, world governments would practice carbon-less months where people would be asked to stay at home while receiving a healthy amount of rations and supplies as to not completely desolate families and freeze the economy. More funding and research went into renewable energy sources to the point where entire cities were being powered by the elements while recycling excess amounts of CO2. Polar icecaps began experiencing growth outside of an ice age to the point where they are now at an equilibrium of freezing and melting.

The best part? Infrastructure has been perfected to where there is no longer war, or poverty as a result of having to figure out how to maintain renewable living with the steady growth of population. Now humanity is looking to colonize other planets as the first few human flights to habitable worlds has been successful. "Wow, this all seems too perfect. I better leave before I discover something awful"

As I make my way back to 2020, I feel hopeful for the future... Now to wait until the current situation of quarantine passes. Too bad no cool movies are coming out thanks to most productions being on haitus. Bogus...

Bill and Ted 3 is still slated for 8/21/2020 due to filming warping up half a year ago!? Most triumphant! *air guitar*

Week 8_Global Warming_Michael Bluett


Charleston Tips South Carolina
Urlaubsguru Travel Magazine


In the year 7010, I wonder what the world would look like. I am from South Carolina and
Charleston is the most coastal town I know. As of now, it floods a lot because the city sits only about 8 feet above sea level. I fear that we have taken too long to try to make impacts on global warming. It is inevitable that the ice caps will melt completely causing the sea to rise so much that Charleston will be completely under the sea. I'm sure we will have fond alternative fuels in order to reduce our emissions into our atmosphere, but I fear we have learn nothing from the Covid-19 era. The whole world was forced inside, and the world became more natural and more beautiful, but once the fears were over, we went back to our normal routines, no longer caring about our effects on our planet.
Artist’s representation of underwater ruins.
Brad Yoon Ancient Origins

Sunday, April 26, 2020

Alexis Torrez

Week 7 - Mesquite Flat Sand Dunes

This week's travels brought me to Death Valley. The most interesting area that I enjoyed was the Mesquite Flat Sand Dunes. A photo found online from Wikipedia shows how beautiful the view is. The three type of dunes located in this area are crescent, linear, and star shaped. There are only a few areas that the sand is trapped and the the dunes cover a small amount of Death Valley, less than 1% to be exact. I would like to know why the color of the sand is so light in this area. I am also interested in why the area of the dunes is so small. I would examine the trees in the area to learn about the natural habitat for wildlife. A geological map might help me locate the source of the dune sands. 


Week 7 - Matt Bulow - Salt Flats

Badwater Basin

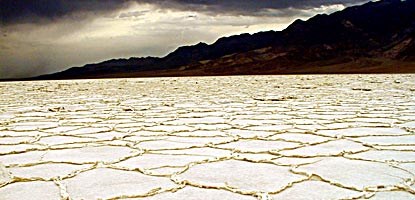
This week I decided to head to Death Valley to check out the salt flats. Death Valley happens to be the lowest National Park in elevation and can have extremely high temperatures. That doesn't stop living things residing there, but in the salt flats, you'll find little to none. As suggested by its own name, the salt flats is essentially flat land made up of salt. The salt flats are located within the Badwater Basin and stretch for nearly 200 square miles. The top layer of salty crust is incredibly delicate and will easily give way and expose the muddy salt underneath. Because of this and it's sheer size, the salt flats within the Badwater Basin is one of the largest protected salt flats in the world.

What makes the salt flats so dry is that there is more evaporation then there is precipitation. This is also why so much salt was left behind. Salt water ran into the basin at one point in time and because basins have no outlets, the water evaporated leaving all of its salt behind. The salt that was left is the exact same salt that we have on our dinner tables or in our spice cabinet. I wanted to take some back home with me because I knew I was running a little low, but I decided against it since it is protected and all. Plus, it is quite fascinating to marvel at and who would want to disturb such a beautiful thing.

Week 7 - Aaron Gomez - Mosaic Canyon

Mosaic Canyon

Mosaic Canyon interests me due to the diversity of rock within one area.  In the photo above we have fairly well-sorted sediment on the floor, then breccia made up of darker ground mass and containing large, angular fragments that are not well-sorted.  Upon closer inspection beneath the breccia, one can see larger rock fragments that is consistent in size and shape among the other small accumulation of similar grains beside it.  It's also asymmetrical.  Meaning one doesn't see the same larger fragments on the left side left side of the canyon.

The bend in the center suggests that the floods that come through here must first run into the right side from a bend behind the photographer, and bending in the opposite direction than the bend ahead.  So the canyon in this location forms an S curve.  This is important because the eroded edge on the right wall in the center probably impedes flow, causing eddies to form and therefore causing larger sediment to lose sufficient velocity so that it accumulates on the right. 

Some questions I have are:

Is the "finer" floor sediment also the same as the ground mass in the breccia? Is it just broken down and better sorted? Perhaps older, and dislodged upstream and transported here eventually?

The very large clast is interesting.  It looks more rounded than the rest of the clasts.  This suggests it traveled much further.  Given its size, it must've also been part of a flood with immense velocity.

What are the age differences of the rocks? A geological map will be useful here.  It might be interesting to ascertain the probable extent of travel by calculating the kind of velocities that would be required to transport the larger clasts to this location from upstream and from various distances.  This would give us a realistic upper flow velocity bound for floods, which could help us narrow our search in the geologic map by confining it to a certain distance from this location. 

Week 7 - Death Valley - Ryan Klassy

Zabriskie Point, Death Valley National Park - Retrieved from: https://cdn.photographylife.com/wp-content/uploads/2015/07/ZabriskiePointValley.jpg
During my field trip to Death Valley, I came across many points that were of geologic interest to me. Of them all, none were m ore beautiful to me than what I saw at Zabriskie Point. This area seems to tell such a beautiful story of erosion by water, despite the extreme lack of water in the area. I can only imagine what this place looks like under heavy flood waters; the waters that have given this landscape the shape it has today.

As I look over the hills, I wonder what these different colors are from. I assume that the lighter and darker colors are different types of rocks. I might want to look for a geologic map of the area as a start. As I look at the geologic map, though, I see that they aren't showing me the layers in the cross-section view that I need, so I look online and find another map, a stratographic map, that shows me the layers of rock as they were deposited and shows me what time periods these were laid down in.

Finding the stratographic map allows me to see the composition of the darker material that was deposited above the lighter material. Erosion has carved most of the dark sediments away, at least in the foreground of this photo, but in the back you can see much more of the darker sediments that have yet to be eroded away.

As time moves on, will this eventually all be light colored sediment with all the dark sediments washed away?

On my field trip I saw a sign that mentioned how parts of Death Valley are below sea level. I would like to know what elevation Zabriskie Point are, so I would find a topographic map. The first place I would look is on the Death Valley National Park's website. I find that the area is actually slightly above sea level at 713 ft.

Zabriskie Point, Death Valley National Park - Retrieved from  https://www.hikespeak.com/img/DV/Zabriskie/Zabriskie_Point_IMG_3872.jpg
Bonus photo! As I was on my hike I stumbled upon this other area at Zabriskie Point. Just when I thought I couldn't have any more questions, I see this! Look at the slope of those layers! I see that there has clearly been some uplift here. Now I want to know what caused these layers of strata to lift like this? The colors are beautiful. I would like to know which colors correspond to which time periods. I see that they are very different in thickness. Which time periods were causing the wider bands and which for the narrow bands? I do believe my stratographic map from earlier might help me with this.

I wonder if I can correlate the lengths of time to the thickness of the layers? I suppose different sediments could have been deposited faster or slower, so thickness of layers won't necessarily tell me how long that took to happen.

So many questions, and from only one quick stop in one small section of death valley!